We will create some brand new tables in SQL Management Studio using Excel as a template in this tutorial.
The sample data is a fictitious list of Experts and their areas of specialty.
Below is a quick Description of our tables and a short sampling of each. This tutorial focuses only on the creation of the tables.
We will populate the tables in the next tutorial. However, it’s good to preview the information so that we understand why we set these up the way we do.
Expert table – Stores the ID, Name, and Birthday of our Experts

Technology Table – Stores the Technology Names and basic Information about the technology

Expert Technology Table – Shows which Technologies the Experts are proficient in

It’s fun to play with information in Excel, but we really want to get this information into SQL because Management there is more optimal.
Create Tables in SQL
Let’s create these three tables in our test database so that we can import data in our Next lesson.
Here is the syntax of an SQL create Statement.
Create Table Table_name (
Column1 datatype,
Column2 datatype,
Column3 datatype
…
Pretty Straightforward right?
The first table to create is our Expert table.
For this exercise, we will use Excel to format the statements for Import to SQL.
Use a separate tab to create your scripts.

Real Quick, these are the Excel functions we will use to put our scripts together.
& Signs – To String Together parts of the statement
“ “Quotes – To Specify parts that are text
CONCAT Symbol – To Pull the entire string together
Notice the formula in Table “column 1” (Column D) of our Excel spreadsheet.
It says, pull the values B5 and B4, our Column names, and data types.
=Sheet1!B5&” “&Sheet1!B4&”,”
Parts that are enclosed in quotations are text.
The & symbol allows us to link parts together when we switch between cell references and text.
Here is the information called from our Create Scripts tab.

Drag the formula from D through our last populated column. H, in this case.
Dragging the formulas will format our additional Column Names and assign them the proper data types.
In addition to our Assigned Columns, there are “System Columns for each”:
Modified by – Displays who updated a record
Timestamp – Displays the time that the record was last updated
Rowcount – can increment to reflect each time the row was updated
The aforementioned system columns are not required, but best practice tracking changes to SQL tables.
Use the Concat Function to String it all together.
=CONCAT(A4:L4)
Here’s our final script, the result of concatenating our results.
Create Table expert(Expert_ID Int,First_Name Varchar(20),Last_Name Varchar(20),Birth_date Date,Modified_By Varchar(20),Timestamp Datetime,Rowcount int;
Now you can paste it into your favorite SQL Editor. For our demo, we will use the fan-favorite SSMS.

Run the Select Statement to check our results

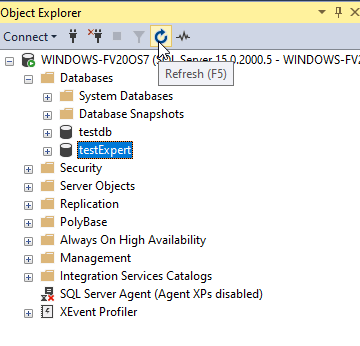
The best way to see if the table is refreshed is to click the “refresh” button in the object Explorer and see if a new Table was created.
TestExpert, Confirmed!!

Now take the concatenated scripts for tables 2 and 3 and run them in SSMS.
Create Table expertTech(Exp TECH ID Int,Expert ID Int,Tech Name Varchar(20),Technology Specialty Int,Specialty Code Varchar(5),Modified_By Varchar(20),Timestamp Datetime,Rowcount int;
Create Table technology(Technology ID Int,Short Tech Name Varchar(5),App Name Varchar(30),Category Varchar(20),Modified_By Varchar(20),Timestamp Datetime,Rowcount int;
Now that’s how you create tables in SQL! Stay tuned for the next tutorial where we populate these tables.


