There are plenty of websites that display stock tickers, technical information, and other important stock Information.
Even though several websites do a fantastic job, sometimes you want to analyze them in your own little spreadsheet.
Getting Stock Market Data into Excel the Old fashioned way
Unless you are waiting for quotes in the next day’s paper, The slowest way to get stock information to Excel is to copy and paste from one website to another.
Hopefully, you’ve discovered the Stock function in Microsoft Excel. It’s an effective tool to upload current Stock Information into a spreadsheet.

Here’s how many people use Excel’s stock functionality.
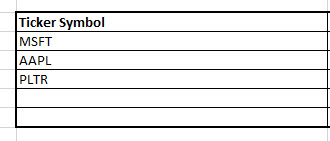
Type in the Ticker Symbol. Alt, A, D,1 if you need the shortcut!

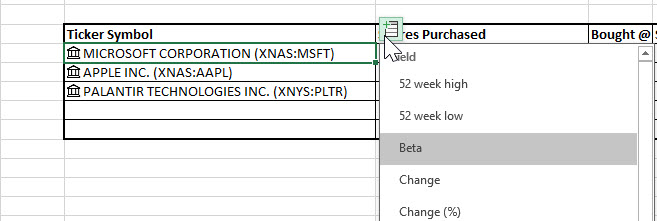
Click the tiny grid symbol and choose the stock-related data that you want to add.
It will populate in the next open column.

This method can get a little wonky if you are trying to move columns around. There’s also a faster way.
The Faster Way to Load Stock data in Excel
Next time you want to agonize over how much money you lost in the Stock Market, try this.
First, set up your table with tickers, headers and add a calculation column. (Bought – Sold in Column H)

Assuming we bought 100 shares at the 52 Week high and sold them at the 52 Week low, (the usual pattern(:), set up this calculation in column H. F-G * E.

Watch what happens if we reference the field with the stock ticker in it. Remember, we need the 52 weeks high and 52 week low.
In the formula, Cell enters the Cell name (the one with the ticker) followed by a period.
D4.

As soon as you type D4 and the period, Excel immediately recognizes it is stock-related. IntelliSense kicks in displays our options. Referencing cells and using intelligence makes for quick Stock Market Data retrieval.
Try it out and have some fun importing Stock Data in Excel.


