Combine one of these Applications with Excel and Land a Job Right Now.
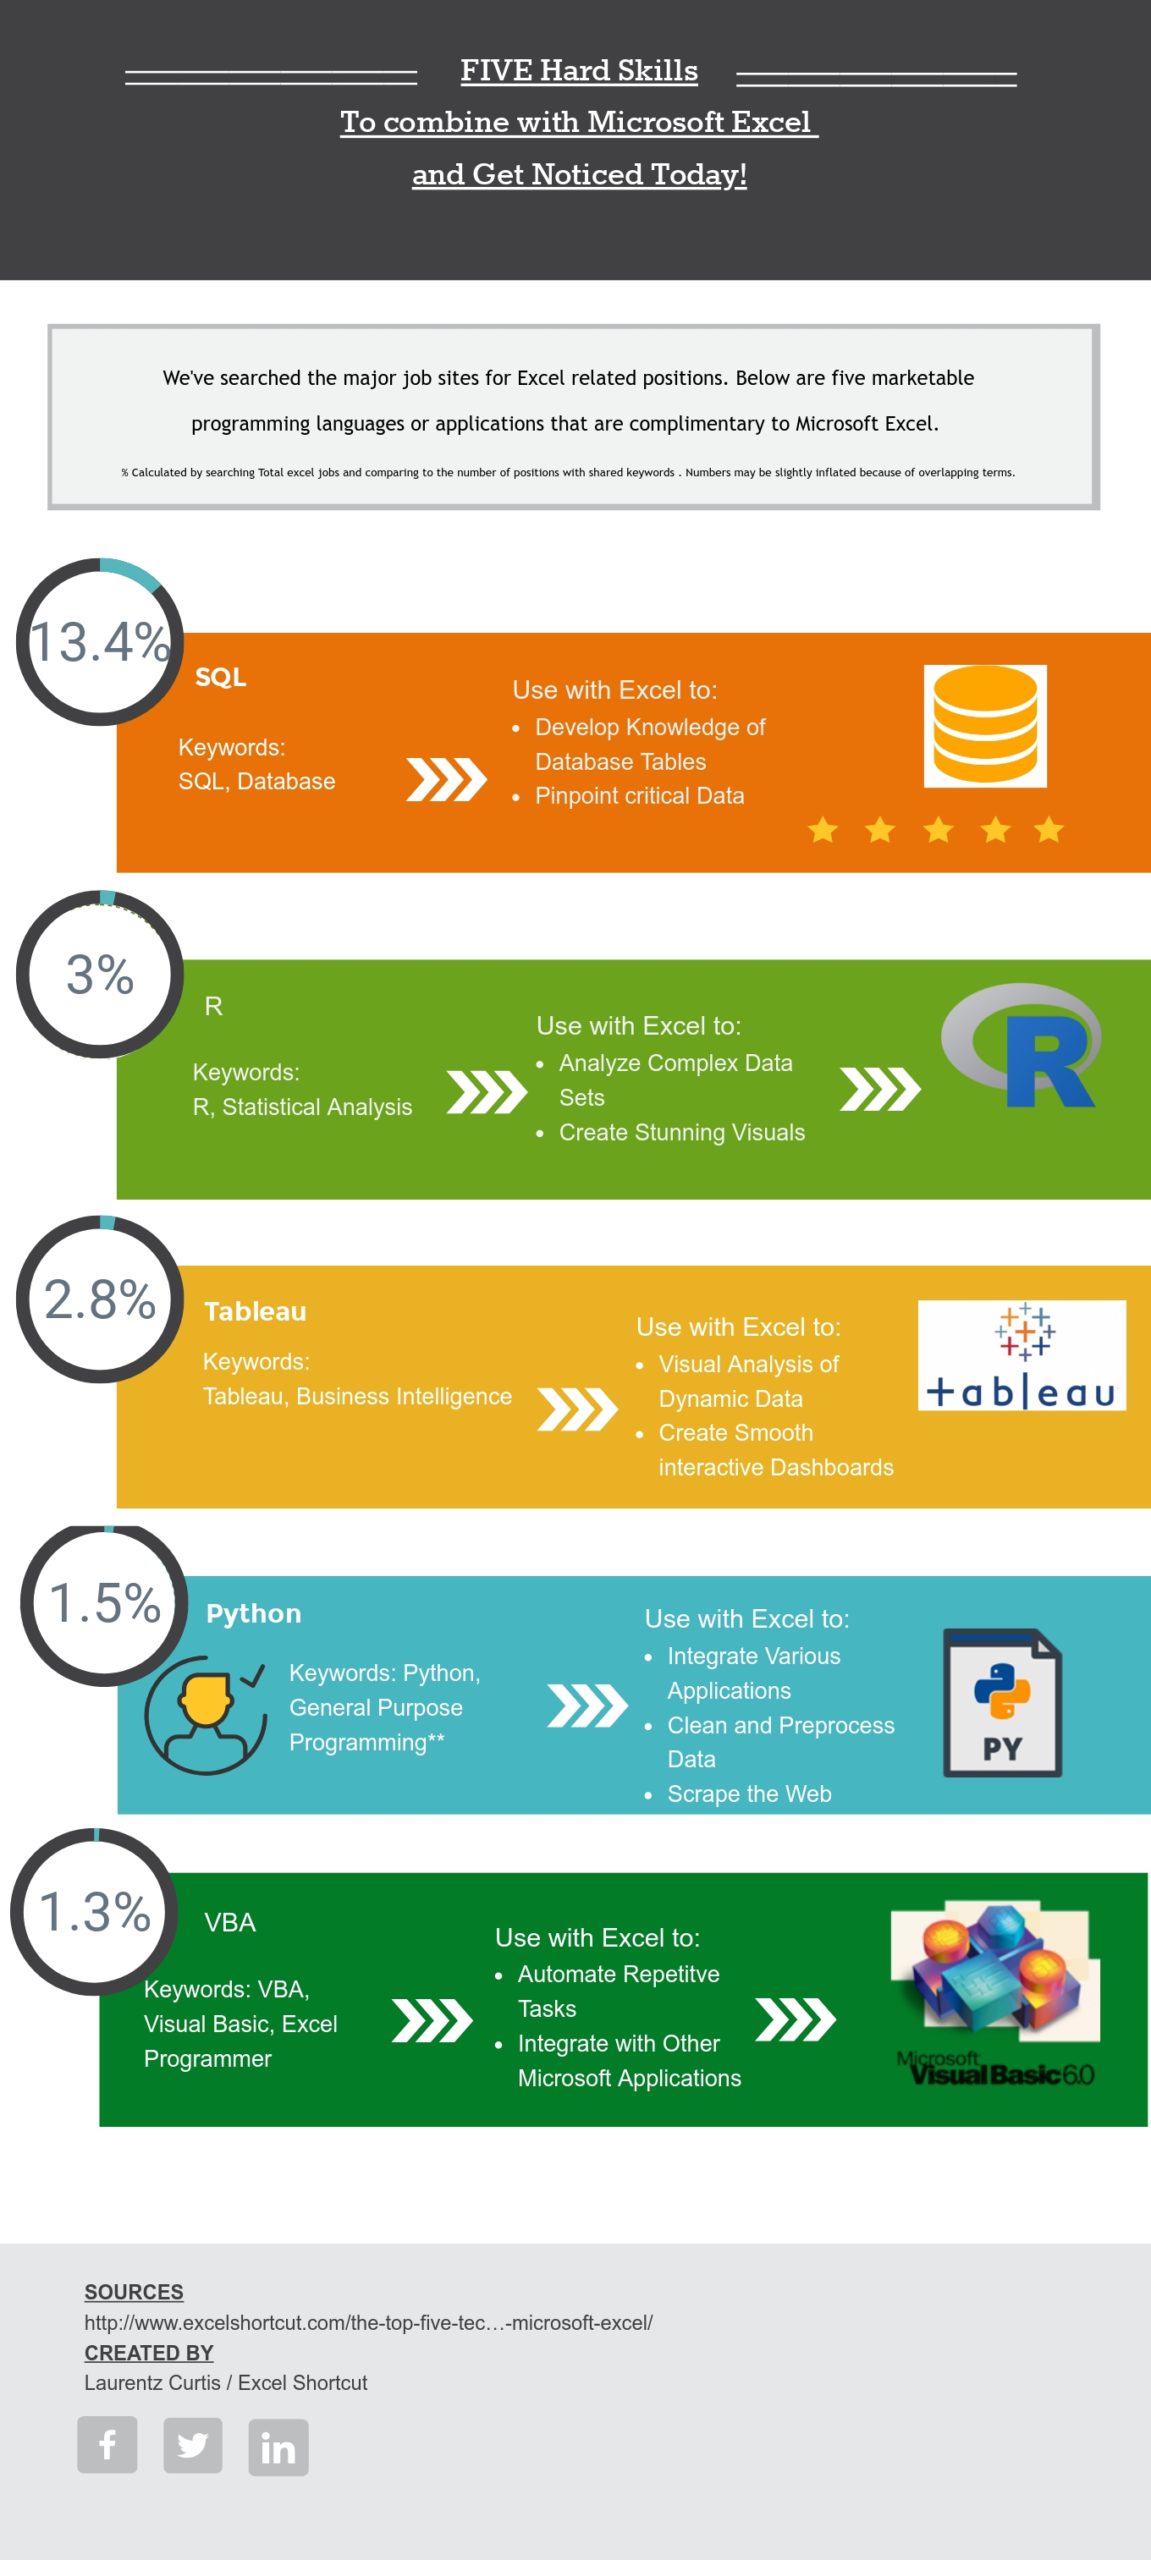
Excel is still the number one application to learn for success in any business arena. Most professionals know this application isn’t going anywhere and have developed some degree of proficiency. To separate yourself from the competition, get versed in at least one of the skills listed below. These are our top five applications or programming languages to pick up for a killer technical combo(with excel!).
Let’s get started with number Five…
5) VBA
Let’s start with the most obvious technology. A list of complementary skills would be grossly incomplete without Visual Basic for Applications (VBA). If you’ve written a macro before, whether by using the recorder or going completely nuts in VBA editor inside the Excel application you’ve probably experienced VBA in some capacity.
One reason VBA is so powerful/useful is that it extends outside of Excel into the Microsoft Suite of Applications. Its purpose is to automate boring repetitive tasks within Microsoft Office Products. This includes data entry, cleaning up data, formatting tables, deleting rows of junk, and endless other examples. By automating the redundant aspects of your excel life, you can shift your focus to more complicated analysis, getting the bosses coffee just right or plain old doing whatever the heck you want.
This should help spice up your job and make you more marketable seeing that you spend your time focusing on the critical stuff.
There are a ton of resources to get started with VBA right now, whether you prefer books, online courses, blogs, or other means of learning, the method that suits your style is out there. One of the best reasons to get started with VBA is that the integrated development environment is built right into the application, no fancy compilers to download.
If you’re an experienced excel user reading this list and don’t know where to start, hit alt F11 and give VBA a try.
4) Python
Python is a well-rounded, high-level programming language with an impressive number of libraries and capabilities. Since it incorporates features from object-oriented, procedural, and scripting languages python is an effective programming language for the integration of various technologies. At the core of python’s competence are its numerous publicly sourced libraries that are readily accessed with a quick command. Python packages specifically designed to work with excel include Openpyxl, Pandas, and Pyexcel.
Python really shines when it comes to preparing data for excel or preprocessing. This includes information retrieval stages like scraping data from external sources or retrieving data from disparate sources. The package BeatifulSoup emerges as a popular tool for extracting data from web documents. Python is also useful in cleaning, parsing, and preprocessing data into excel. Don’t underestimate the power to integrate your excel worksheets with other applications. It’s a general-purpose programming language, meaning it crosses the operating system and various application boundaries.
Python is a very useful tool for automating repetitive tasks in many applications, including excel. One example specific to excel utilizes the py module openpyxl. Using openpyxl you can access tables meeting specified criteria from a large set of excel worksheets. Once you gain familiarity with this python function you can readily retrieve, manipulate and move data through the command line of your choice.
3) Tableau
Tableau is a visually oriented software designed to make raw data understandable for ordinary people. This extends to tables stored in a database or excel spreadsheets. While the market is crowded with solutions for business intelligence and reporting, tableau has emerged as an industry favorite for dashboard analytics, encompassing end-user dashboards and data discovery.
Tableau developers understand that most analysts aren’t ready to leave Microsoft Excel and that’s why they make sure tableau integrates easily with the application. When you feed excel information to Tableau, you can take advantage of Tableau’s drag and drop interface and manipulate data visually in real-time. The scope of analysis extends beyond one or even multiple excel workbooks and extends to data outside of excel. Excel and Tableau are a very effective combination for visual analysis and appropriately querying dynamic data.
2) R
For large datasets, many professional statisticians, quantitative financial experts, and big data gurus utilize the robust data handling environment known as R. R is a free open source interpreted program with an extensive library. Although Graphical user interfaces are available for R, users primarily access R through command-line scripting.
Many programmers report a steeper learning curve in comparison to programming languages they learned prior to R. Approach R with an open mind as it is not a conventional programming language. Among other features for data analysts, R boasts an extensive library of tools for data analysts and graphical modeling capabilities.
Some R aficionados will suggest that once you get proficient with R, your need to analyze information in excel will dissolve. Others argue both applications have their own respective time and place. Once you get the hang of R, you will know when the occasion calls for the use of R or excel. R seems to work better with more complex data sets, data in a more raw form, or when you need to express complex data with stunning visuals. If you choose to use R in conjunction with Microsoft Excel, make sure to utilize the RExcel add-in for Excel. RExcel utilizes the excel application as a front-end interface for R functionality. It allows two-way data transfers as well as running R code in excel and embedding R functions within excel formulas.
1) SQL
SQL, the abbreviation for structured query language is specially designed for working with databases. Since most large datasets are contained by or should be organized in a database, SQL is a helpful tool for any data analyst. Most data analysts are primarily required to use Structured Query language to run queries against databases and execute minor updates in some cases. The heavy lifting of creating tables, procedures, indexes, and database optimization is most often performed by a database Administrator and outside the scope of our discussion. Whether the database is Access, SQL Server, MySQL, or oracle most of the language is common with some minor variations in syntax.
The most essential elements a user extracts from working with SQL are knowledge and navigation of the data tables. The knowledge of the structure and whereabouts of critical fields is very helpful for designing reports. Rather than a raw data dump generated from a “select all” query, a skilled query writer can pinpoint the critical fields and cut back the amount of sorting and erroneous data cleanup from the excel user end. You will rapidly develop knowledge if you study the data dictionary, learn the structure of the tables, identify primary and foreign keys and relations between tables.
Many SQL users use Excel as a front-end interface for their data analysis with SQL code running in the background. Excel makes this feasible, allowing for direct connections to data tables outside of the application. This permits quick refreshes of external datasets. Well-optimized queries go a long way since poorly written queries embedded in excel make the application run much more slowly. Who has time to wait for reports to load?
We just discussed a few technical paths combined with excel to increase the value you provide to your company or clients. There are obviously way more skills and fun technologies you can learn, too many for us to discuss today. Learn a new skill today or share your knowledge to turn eager students into software superheroes.


